SkyProj HealSparse and Healpix Mapping
The primary goal of SkyProj is to display HealSparse and HEALPix maps. For speed and efficiency, map plotting in SkyProj is performed by first rasterizing the input map at a resolution appropriate for the given plot. In this way, complicated and expensive calculations of individual healpix pixel boundaries can be avoided, leading to good performance even for very high resolution maps plotted over the full sky.
HealSparse Map Plots
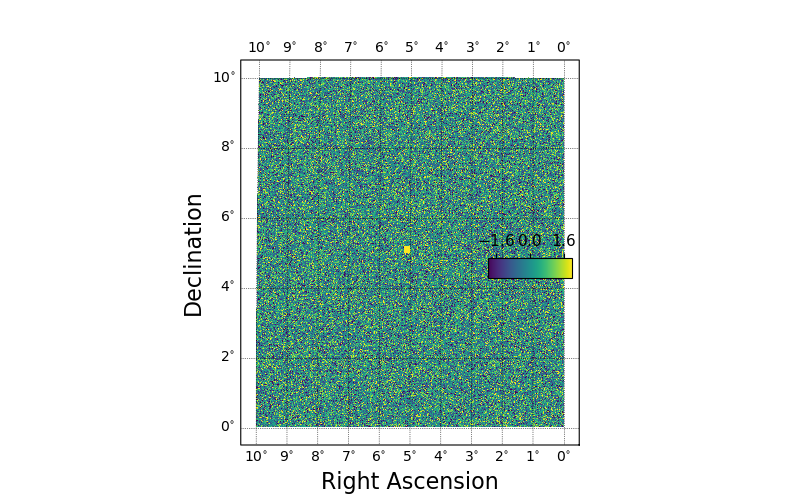
Plotting HealSparse maps can be performed with the draw_hspmap() method on a skyproj.Skyproj() subclass.
The default setting for drawing a map is to automatically zoom in on the ra/dec range of the map to be plotted.
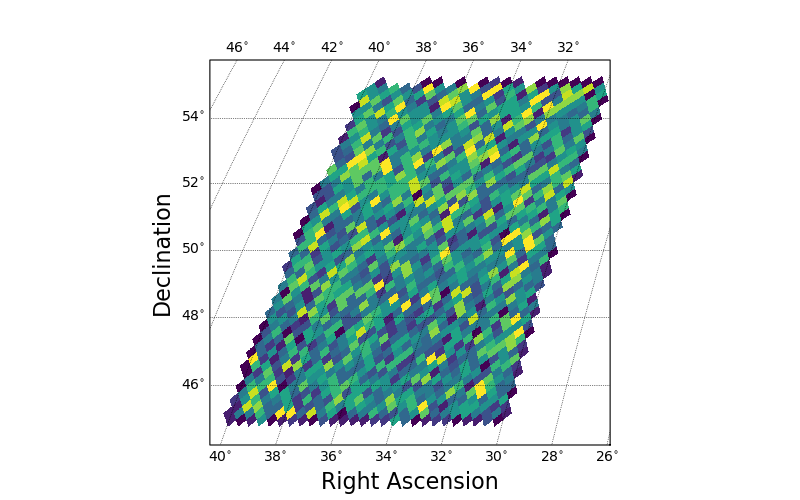
The valid_mask=True option will plot the valid pixels (instead of the values in the pixels) in a map.
import matplotlib.pyplot as plt
import numpy as np
import healsparse as hsp
import skyproj

# Make a square noise field.
hspmap = hsp.HealSparseMap.make_empty(32, 4096, np.float32)
poly = hsp.geom.Polygon(ra=[0.0, 10.0, 10.0, 0.0], dec=[0.0, 0.0, 10.0, 10.0], value=1.0)
pixels = poly.get_pixels(nside=hspmap.nside_sparse)
hspmap[pixels] = np.random.normal(size=pixels.size).astype(np.float32)
# Add in a central square of fixed value.
poly2 = hsp.geom.Polygon(ra=[5, 5.2, 5.2, 5.0], dec=[5, 5.0, 5.2, 5.2], value=3.0)
pixels2 = poly2.get_pixels(nside=hspmap.nside_sparse)
hspmap[pixels2] = 3.0

fig, ax = plt.subplots(figsize=(8, 5))
sp = skyproj.McBrydeSkyproj(ax=ax)
im, lon_raster, lat_raster, values_raster = sp.draw_hspmap(hspmap)
sp.draw_inset_colorbar()
plt.show()
fig, ax = plt.subplots(figsize=(8, 5))
sp = skyproj.McBrydeSkyproj(ax=ax)
im, lon_raster, lat_raster, values_raster = sp.draw_hspmap(hspmap, valid_mask=True)
sp.draw_inset_colorbar()
plt.show()
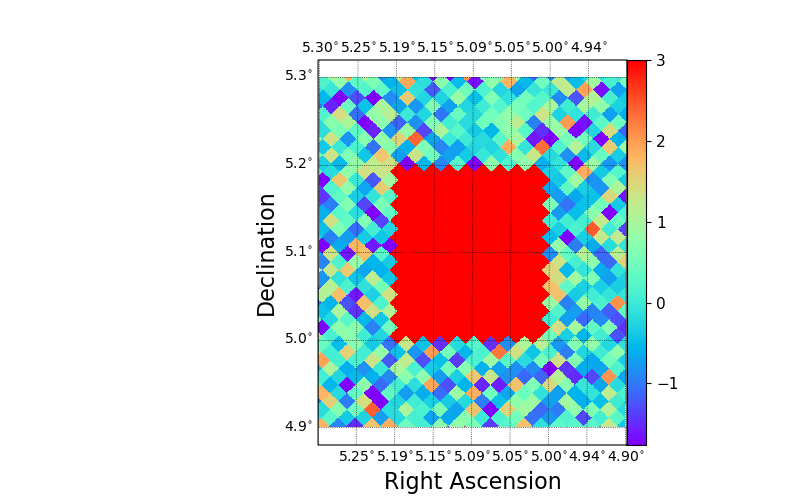
If plotting in an interactive session, one can now zoom into the map with the matplotlib zoom tool. Alternatively, one can specify the longitude and latitude range when drawing the map. In the following example, we also use a different colormap and draw an external colorbar. Note that at this zoom level the individual shapes of the HEALPix pixels are visible.
fig, ax = plt.subplots(figsize=(8, 5))
sp = skyproj.McBrydeSkyproj(ax=ax)
sp.draw_hspmap(hspmap, lon_range=[4.9, 5.3], lat_range=[4.9, 5.3], cmap=plt.colormaps['rainbow'])
sp.draw_colorbar()
plt.show()
HEALPix Map Plots
Plotting HEALPix maps can be performed with the draw_hpxmap() method on a skyproj.Skyproj() subclass.
This code is very similar to that of of draw_hspmap() above, although it does require the full map to be in memory (which is the primary advantage of HealSparse maps).
The default setting for drawing a map is to automatically zoom in on the ra/dec range of the map to be plotted.
The plotting and interactivity options are the same as for draw_hspmap().
hpxmap = hspmap.generate_healpix_map()

fig, ax = plt.subplots(figsize=(8, 5))
sp = skyproj.McBrydeSkyproj(ax=ax)
sp.draw_hpxmap(hpxmap, nest=True)
sp.draw_inset_colorbar()
plt.show()
HEALPix Pixel Plots
Given a list of HEALPix pixel numbers and values, the draw_hpxpx() method is available.
The map output is very similar to the code above.
However, this code does pixel value lookups behind the scenes to conserve memory.
In some cases it may be faster to use the pixels to build a HealSparse map and then use the draw_hspmap() method instead.
The plotting and interactivity options are the same as for draw_hspmap().
pixels = hspmap.valid_pixels
values = hspmap[pixels]

fig, ax = plt.subplots(figsize=(8, 5))
sp = skyproj.McBrydeSkyproj(ax=ax)
# Note that you have to specify the nside when using draw_hpxpix.
sp.draw_hpxpix(4096, pixels, values, nest=True)
sp.draw_inset_colorbar()
plt.show()
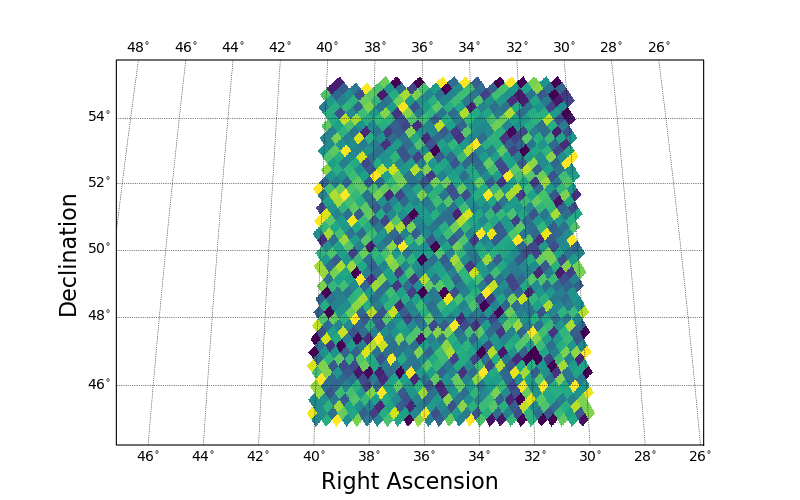
HEALPix Binned Plots
Given a list of positions and values, one can use draw_hpxbin() to bin the values and make a map.
This is analagous to matplotlib.pyplot.hexbin, with the additional assurance that each pixel has the same area.
np.random.seed(1234)
ra = np.random.uniform(low=30.0, high=40.0, size=10000)
dec = np.random.uniform(low=45.0, high=55.0, size=10000)
C = np.random.uniform(low=0.0, high=10.0, size=10000)

fig, ax = plt.subplots(figsize=(8, 5))
sp = skyproj.McBrydeSkyproj(ax=ax)
# Default nside is 256.
sp.draw_hpxbin(ra, dec, C=C)
plt.show()
The default projection shown here has a central longitude of 0.0, which is not ideal for the Right Ascension range in this figure.
If one is running in an interactive matplotlib window, typing R in the window will reproject at the center of the plotted data.