SkyProj Surveys
SkyProj has pre-defined a number of survey classes. These classes have been set with a preferred projection type and axis ranges, as well as defining methods to draw the survey outline. Note that when using these survey classes to create a projection, then when you plot a map the default is not to zoom in on the range of the map, but to keep the survey range.
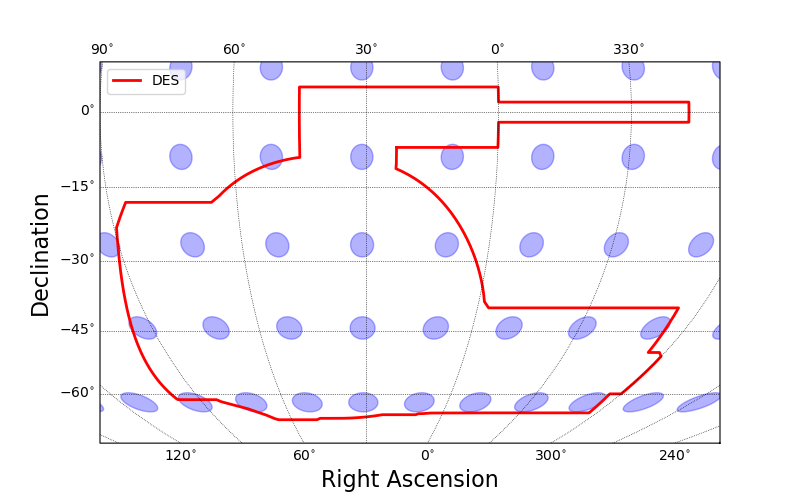
DESSkyproj
The skyproj.DESSkyproj() projection sets the projection for plotting the survey outline of the Dark Energy Survey (DES).
The default for DES uses the skyproj.McBrydeSkyproj() centered at +30 degrees longitude.
The outline of DES can be accessed with draw_des().
import matplotlib.pyplot as plt
import skyproj

fig, ax = plt.subplots(figsize=(8, 5))
sp = skyproj.DESSkyproj(ax=ax)
sp.draw_des(label='DES')
sp.tissot_indicatrices(radius=2.5, num_lon=18, num_lat=10, color='blue', alpha=0.3)
sp.ax.legend()
plt.show()
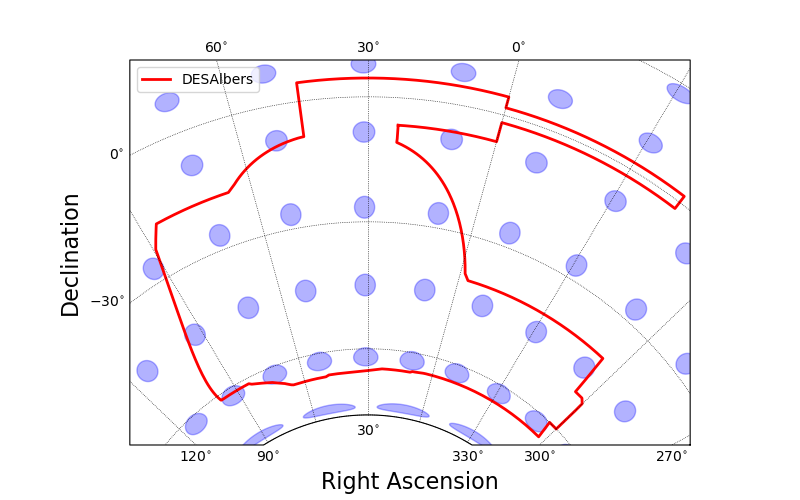
DESAlbersSkyproj
The skyproj.DESAlbersSkyproj() projection sets the projection for plotting the survey outline of the DES using an Albers Equal Area projection.
The default for DES (Albers) uses the skyproj.AlbersSkyproj() centered at +30 degrees longitude, with standard parallels at -15 degrees and -50 degrees latitude.
The outline of DES can be accessed with draw_des().
import matplotlib.pyplot as plt
import skyproj

fig, ax = plt.subplots(figsize=(8, 5))
sp = skyproj.DESAlbersSkyproj(ax=ax)
sp.draw_des(label='DESAlbers')
sp.tissot_indicatrices(radius=2.5, num_lon=18, num_lat=10, color='blue', alpha=0.3)
sp.ax.legend()
plt.show()
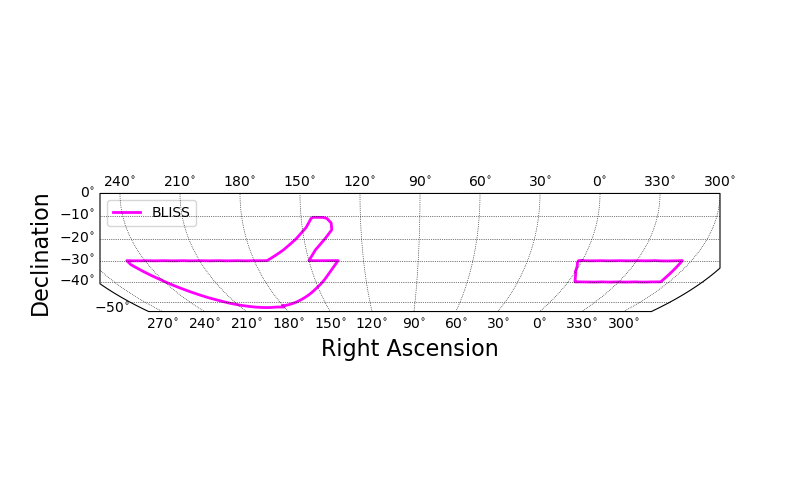
BlissSkyproj
The skyproj.BlissSkyproj() projection sets the projection for plotting the survey outline of the Blanco Imaging of the Southern Sky (BLISS) survey.
The default for BLISS uses the skyproj.McBrydeSkyproj() centered at 100 degrees longitude.
The outline of BLISS can be accessed with draw_bliss().
import matplotlib.pyplot as plt
import skyproj

fig, ax = plt.subplots(figsize=(8, 5))
sp = skyproj.BlissSkyproj(ax=ax)
sp.draw_bliss(label='BLISS')
sp.ax.legend()
plt.show()
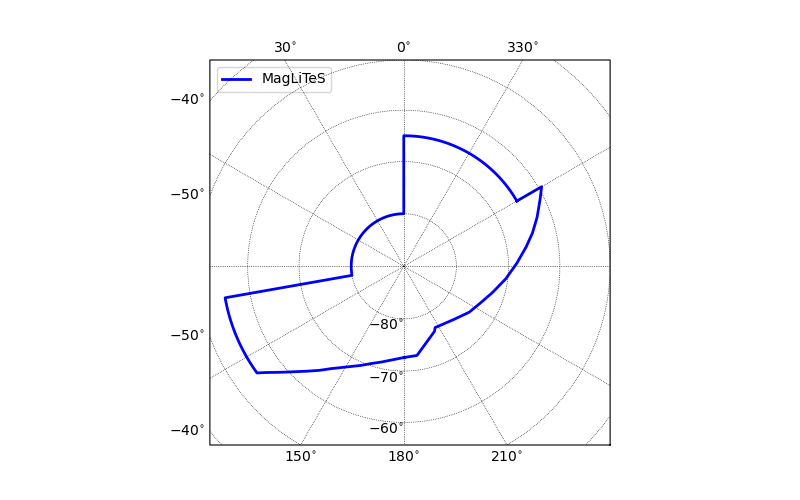
MaglitesSkyproj
The skyproj.MaglitesSkyproj() projection sets the projection for plotting the survey outline of the Magellanic Satellites Survey (MagLiteS).
The default for MagLiteS uses the skyproj.LaeaSkyproj() centered at the South Pole.
The outline of MagLiteS can be accessed with draw_maglites().
import matplotlib.pyplot as plt
import skyproj

fig, ax = plt.subplots(figsize=(8, 5))
sp = skyproj.MaglitesSkyproj(ax=ax)
sp.draw_maglites(label='MagLiteS')
sp.ax.legend()
plt.show()
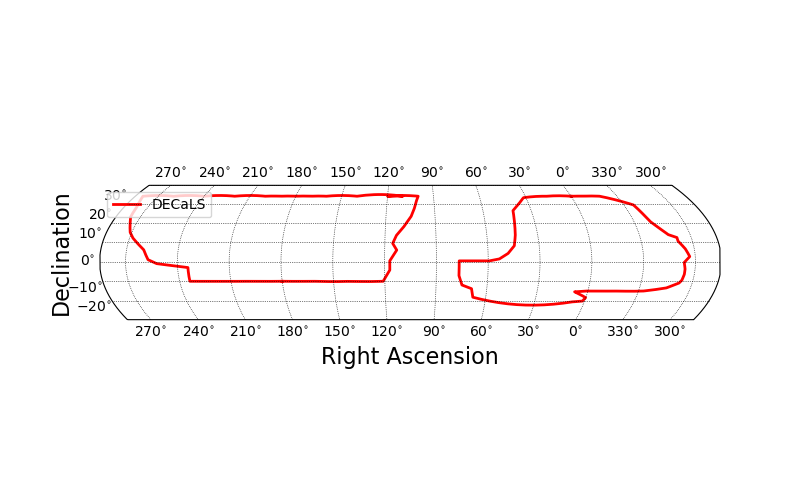
DecalsSkyproj
The skyproj.DecalsSkyproj() projection sets the projection for plotting the survey outline of the Dark Energy Camera Legacy Survey (DECaLS).
The default for DECaLS uses the skyproj.McBrydeSkyproj() centered at 105 degrees longitude.
The outline of DECaLS can be accessed with draw_decals().
import matplotlib.pyplot as plt
import skyproj

fig, ax = plt.subplots(figsize=(8, 5))
sp = skyproj.DecalsSkyproj(ax=ax)
sp.draw_decals(label='DECaLS')
sp.ax.legend()
plt.show()
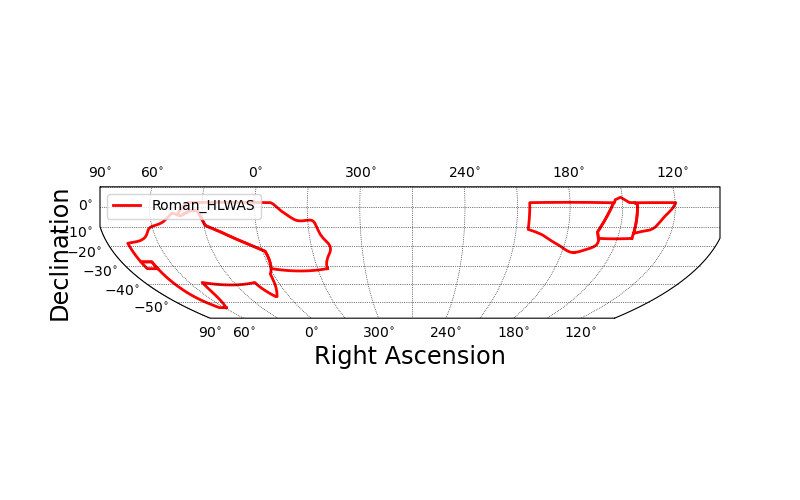
RomanHLWASSkyproj
The skyproj.RomanHLWASSkyproj() projection sets the projection for plotting the survey outline of the Roman Space Telescope
High Latitude Wide Area Survey (HLWAS).
The default for the Roman HLWAS uses the skyproj.McBrydeSkyproj() centered at -90 degrees longitude.
The outline of the Roman HLWAS can be accessed with draw_roman_hlwas().
import matplotlib.pyplot as plt
import skyproj

fig, ax = plt.subplots(figsize=(8, 5))
sp = skyproj.RomanHLWASSkyproj(ax=ax)
sp.draw_roman_hlwas(label='Roman HLWAS')
sp.legend()
plt.show()